ABG Calculator: Interpret Arterial Blood Gases Step by Step
An arterial blood gas (ABG) can tell you much more than whether a patient is acidotic or alkalotic. The combination of pH, partial pressure of carbon dioxide (PaCO₂), and bicarbonate (HCO₃⁻) helps reveal the primary acid–base disturbance, while the expected compensatory response can uncover a second disorder that might otherwise be missed.
This free ABG calculator helps medical students and healthcare professionals organize arterial blood gas results into a structured interpretation. Enter your patient’s values to assess acidemia or alkalemia, distinguish respiratory from metabolic disturbances, and evaluate whether compensation is appropriate.
ABG Calculator
Interpret arterial blood gases with a structured acid–base assessment, compensation checks, anion gap, and oxygenation estimates.
Enter blood gas values
Use values from the same sample when possible.
Advanced settings
Results are estimates for educational support. Always interpret blood gases with the patient's clinical condition and local laboratory reference ranges.
Interpretation
Calculated findings appear here after interpretation.
Enter blood gas values, then select “Interpret ABG” to see the step-by-step analysis.
What Is an ABG Calculator?
An ABG calculator is a clinical calculation tool used to interpret arterial blood gas measurements. Depending on the features available, it can classify the primary acid–base disorder, estimate expected respiratory or renal compensation, and calculate additional values such as the anion gap.
A useful interpretation considers three core measurements:
pH: Indicates the overall acid–base state of the blood.
PaCO₂: Reflects the respiratory contribution to acid–base balance.
HCO₃⁻: Reflects the metabolic contribution, although measured and calculated bicarbonate values are not necessarily interchangeable in every context.
The relationship among these values matters more than any single result. For example, a low pH with elevated PaCO₂ suggests respiratory acidosis, while a low pH with reduced bicarbonate suggests metabolic acidosis. The compensation pattern then helps determine whether the initial interpretation is complete.
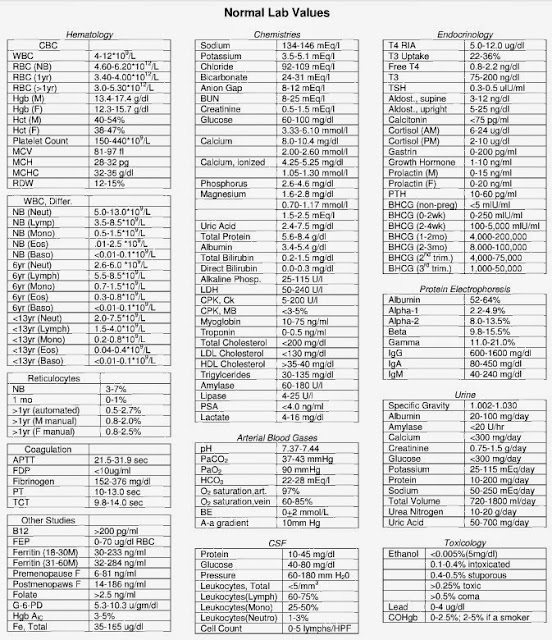
Normal ABG Values
Reference intervals vary slightly among laboratories. The following values are commonly used for adult arterial blood gases at sea level.
| Measurement | Common reference range |
|---|---|
| Arterial pH | 7.35–7.45 |
| PaCO₂ | 35–45 mmHg |
| HCO₃⁻ | 22–26 mEq/L |
| PaO₂ | Approximately 80–100 mmHg in healthy young adults |
| Oxygen saturation | Commonly 95–100% in healthy adults |
PaO₂ depends on age, inspired oxygen concentration, altitude, and underlying cardiopulmonary disease. Oxygen saturation also depends on the measurement method and clinical circumstances.
These ranges are reference points, not universal treatment targets. A result outside the normal range must be interpreted alongside the patient’s condition, oxygen support, medications, and previous blood gas measurements.
How to Interpret an ABG
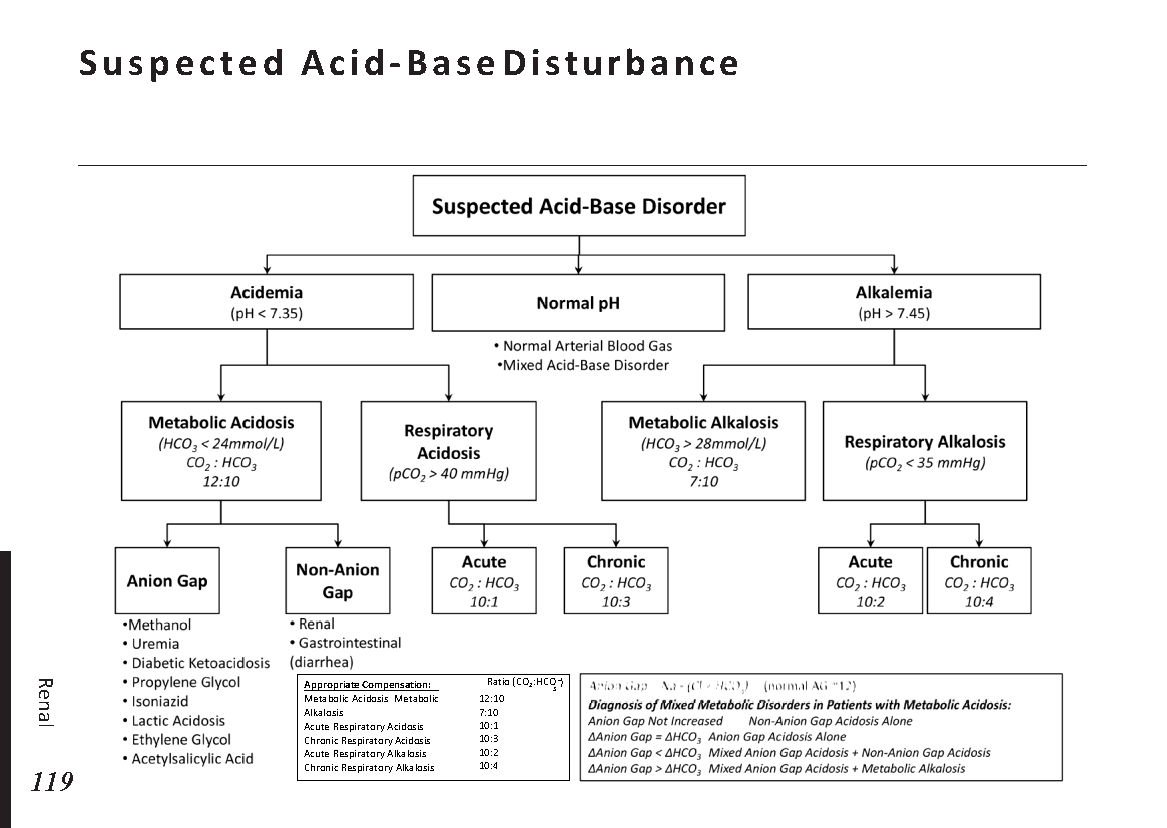
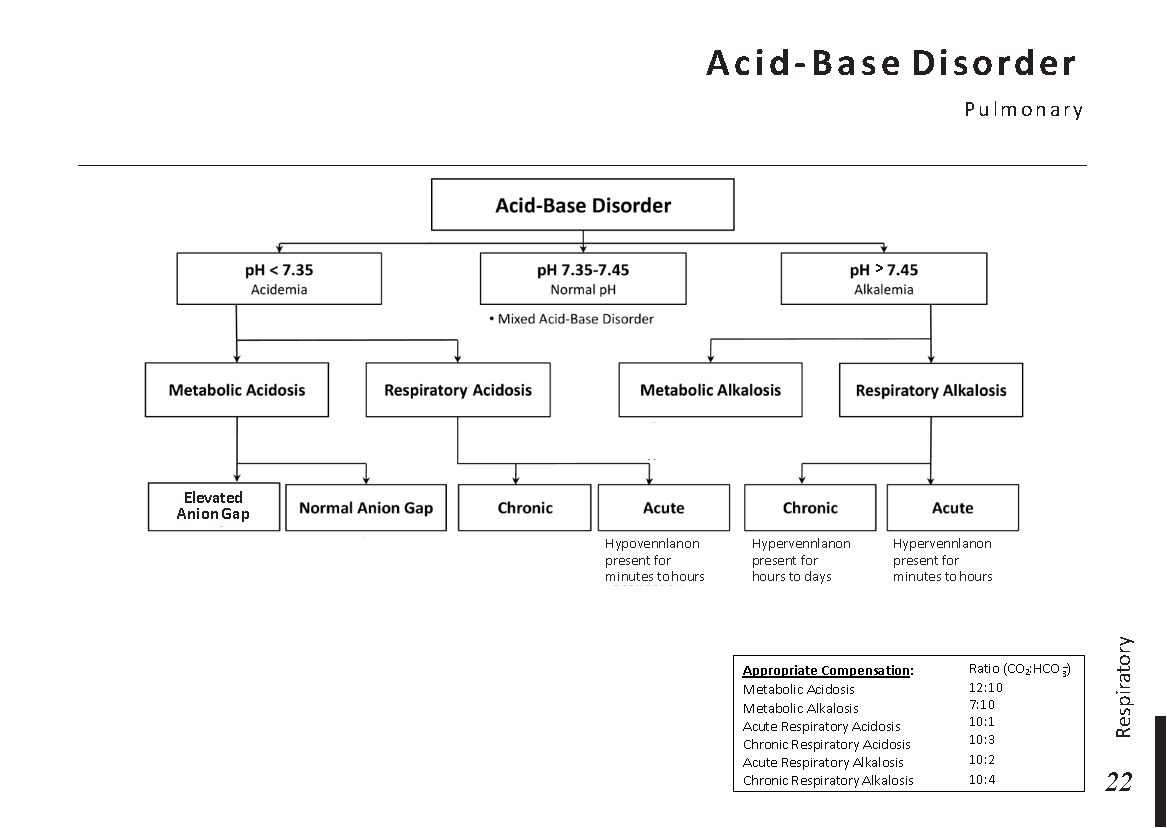
Step 1: Check the pH
Start by deciding whether the blood is acidemic, alkalemic, or within the reference interval.
pH below 7.35: Acidemia.
pH above 7.45: Alkalemia.
pH between 7.35 and 7.45: Within the usual reference interval.
A normal pH does not exclude an acid–base disorder. Two opposing primary disorders can produce a pH within the reference interval, and chronic compensation may also bring the pH closer to normal.
Step 2: Identify the primary process
Compare PaCO₂ and HCO₃⁻ with the pH.
| Primary disorder | Typical pattern |
|---|---|
| Metabolic acidosis | Low pH, low HCO₃⁻ |
| Metabolic alkalosis | High pH, high HCO₃⁻ |
| Respiratory acidosis | Low pH, high PaCO₂ |
| Respiratory alkalosis | High pH, low PaCO₂ |
These are typical patterns rather than a complete diagnostic rule. If the pH and the apparent primary process do not agree, consider a mixed disorder, a near-normal pH, or limitations in the available measurements.
Step 3: Check whether compensation is appropriate
The body compensates for primary acid–base disturbances through respiratory or renal mechanisms. Compensation usually moves the pH toward normal, but it does not generally correct the underlying disturbance completely.
For metabolic acidosis, Winter’s formula estimates the expected PaCO₂:
Expected PaCO₂ = (1.5 × HCO₃⁻) + 8 ± 2 mmHg
Measured PaCO₂ within the expected range supports appropriate respiratory compensation.
Measured PaCO₂ above the expected range suggests an additional respiratory acidosis.
Measured PaCO₂ below the expected range suggests an additional respiratory alkalosis.
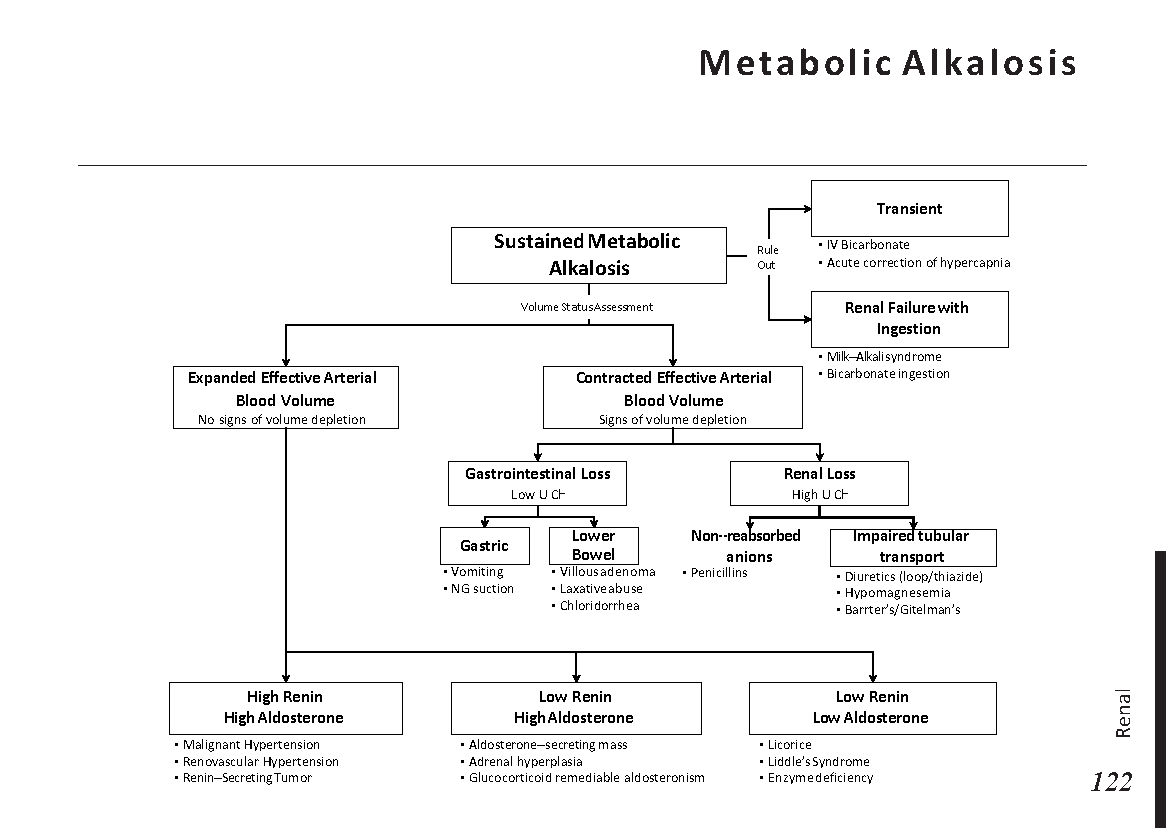
For metabolic alkalosis, expected PaCO₂ generally rises as bicarbonate increases. A commonly used estimate is:
Expected PaCO₂ ≈ 40 + 0.7 × (HCO₃⁻ − 24) mmHg
This is an approximation; clinical references use slightly different compensation estimates and ranges.
Respiratory disorders require a different approach. In uncomplicated respiratory acidosis, bicarbonate typically increases by approximately 1 mEq/L per 10 mmHg rise in PaCO₂ in an acute setting and 3.5–4 mEq/L per 10 mmHg in a chronic setting. In respiratory alkalosis, bicarbonate typically decreases by approximately 2 mEq/L per 10 mmHg fall in PaCO₂ acutely and 4–5 mEq/L chronically.
These are clinical rules of thumb. Duration, kidney function, baseline bicarbonate, and coexisting disorders can change the observed response.
Step 4: Look for a mixed acid–base disorder
A mixed disorder occurs when more than one primary acid–base process is present at the same time. It is particularly important to consider when compensation falls outside the expected range.
For instance, a patient with metabolic acidosis and an unexpectedly high PaCO₂ may have concurrent respiratory acidosis. A patient with metabolic acidosis and a PaCO₂ substantially below Winter’s expected range may have additional respiratory alkalosis.
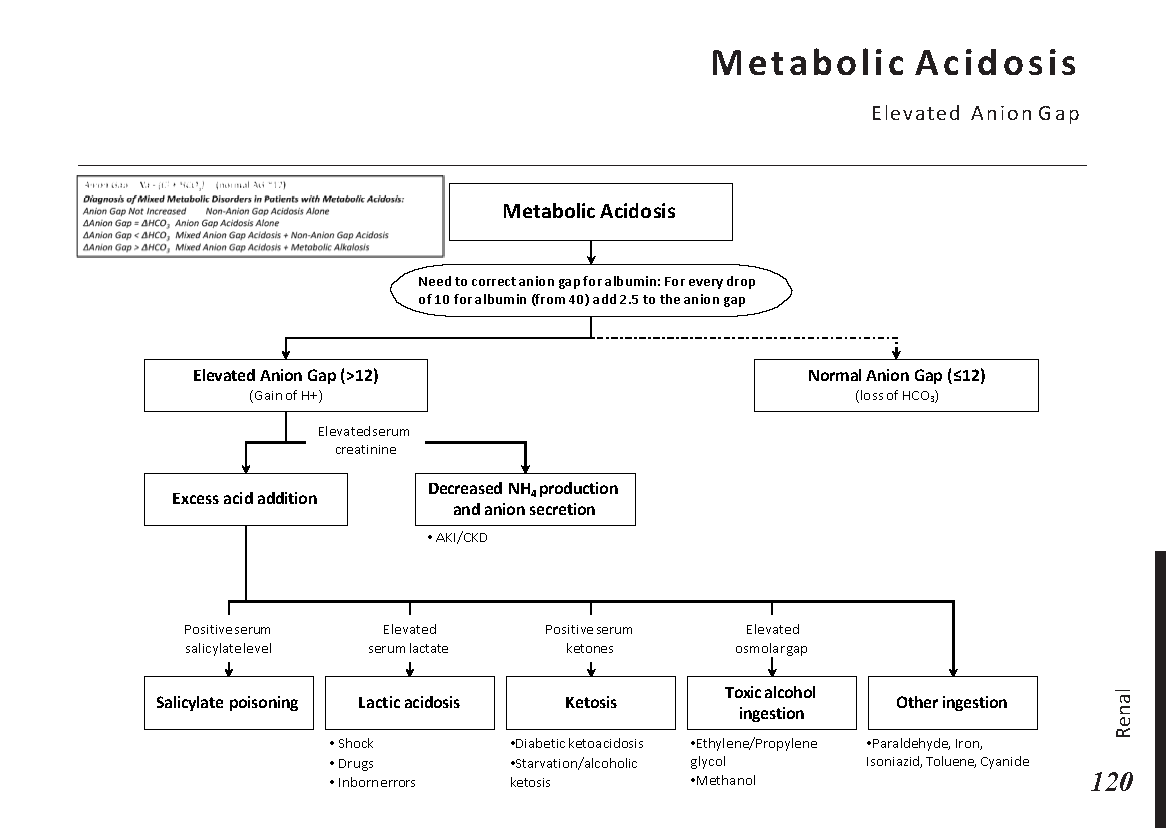
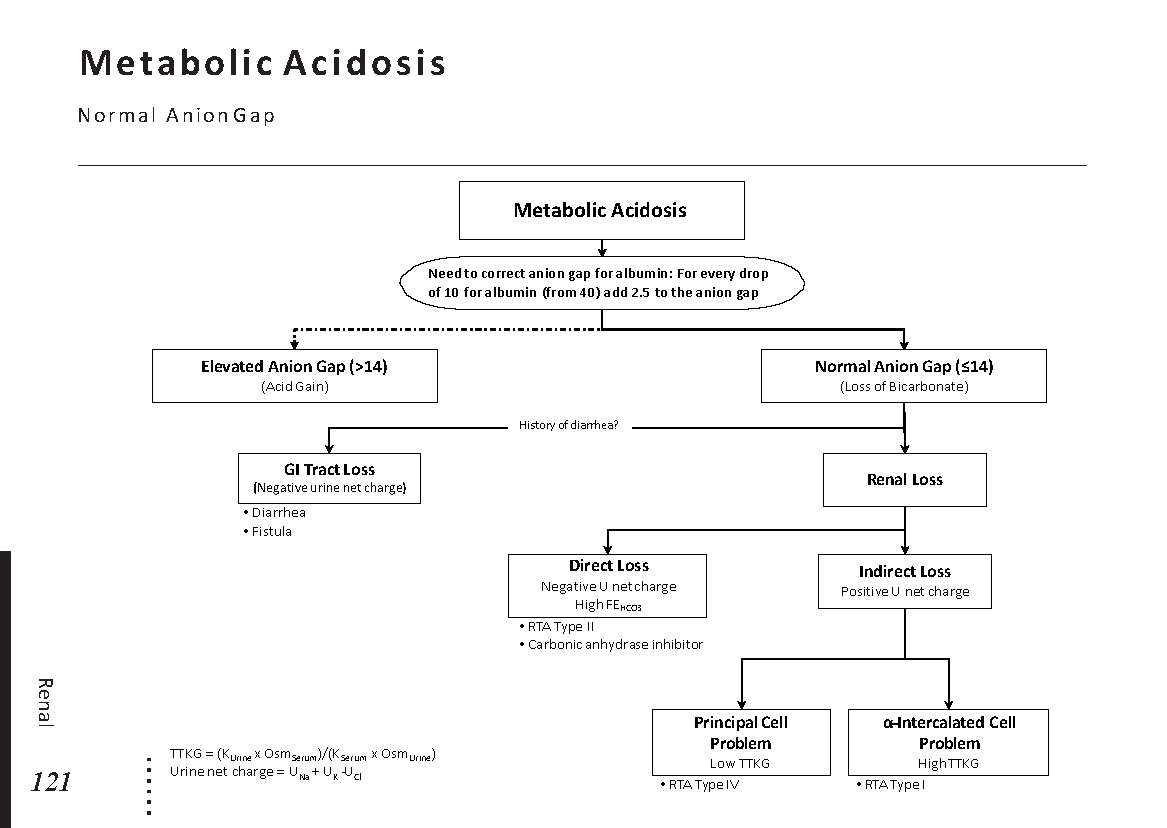
The anion gap can provide another useful clue when metabolic acidosis is present.
Anion gap = Na⁺ − (Cl⁻ + HCO₃⁻)
A high anion gap suggests the presence of additional unmeasured anions. Albumin is a major unmeasured anion, so hypoalbuminemia can conceal an elevated gap. Consider albumin correction when appropriate and use the laboratory’s reference interval.
Step 5: Assess oxygenation separately
Acid–base interpretation and oxygenation assessment are related but distinct tasks. PaO₂ should be interpreted alongside the inspired oxygen concentration (FiO₂), respiratory support, age, and clinical presentation.
The PaO₂/FiO₂ ratio can help assess the degree of oxygenation impairment, particularly in critically ill patients. The alveolar–arterial oxygen gradient may also be useful when investigating hypoxemia.
A satisfactory pH does not establish that oxygenation is adequate, and a normal PaO₂ on supplemental oxygen does not necessarily mean pulmonary gas exchange is normal.
Worked ABG Example
Consider the following arterial blood gas:
pH: 7.25
PaCO₂: 25 mmHg
HCO₃⁻: 11 mEq/L
First, assess the pH. The pH of 7.25 indicates acidemia.
Next, identify the primary disorder. Bicarbonate is markedly reduced, supporting primary metabolic acidosis.
Then, calculate expected compensation.
Winter’s formula gives:
Expected PaCO₂ = (1.5 × 11) + 8 ± 2
Expected PaCO₂ = 24.5 ± 2 mmHg
The expected range is approximately 22.5–26.5 mmHg. The measured PaCO₂ of 25 mmHg falls within this range, supporting appropriate respiratory compensation.
Interpretation: Metabolic acidosis with respiratory compensation consistent with Winter’s formula.
This does not establish the cause of the metabolic acidosis. The next steps depend on the clinical context and may include calculating the anion gap, reviewing lactate and ketones, assessing renal function, and investigating possible toxic exposures.
 Menstrual cycle physiology: